верно. Надо соблюдать формат сообщения:
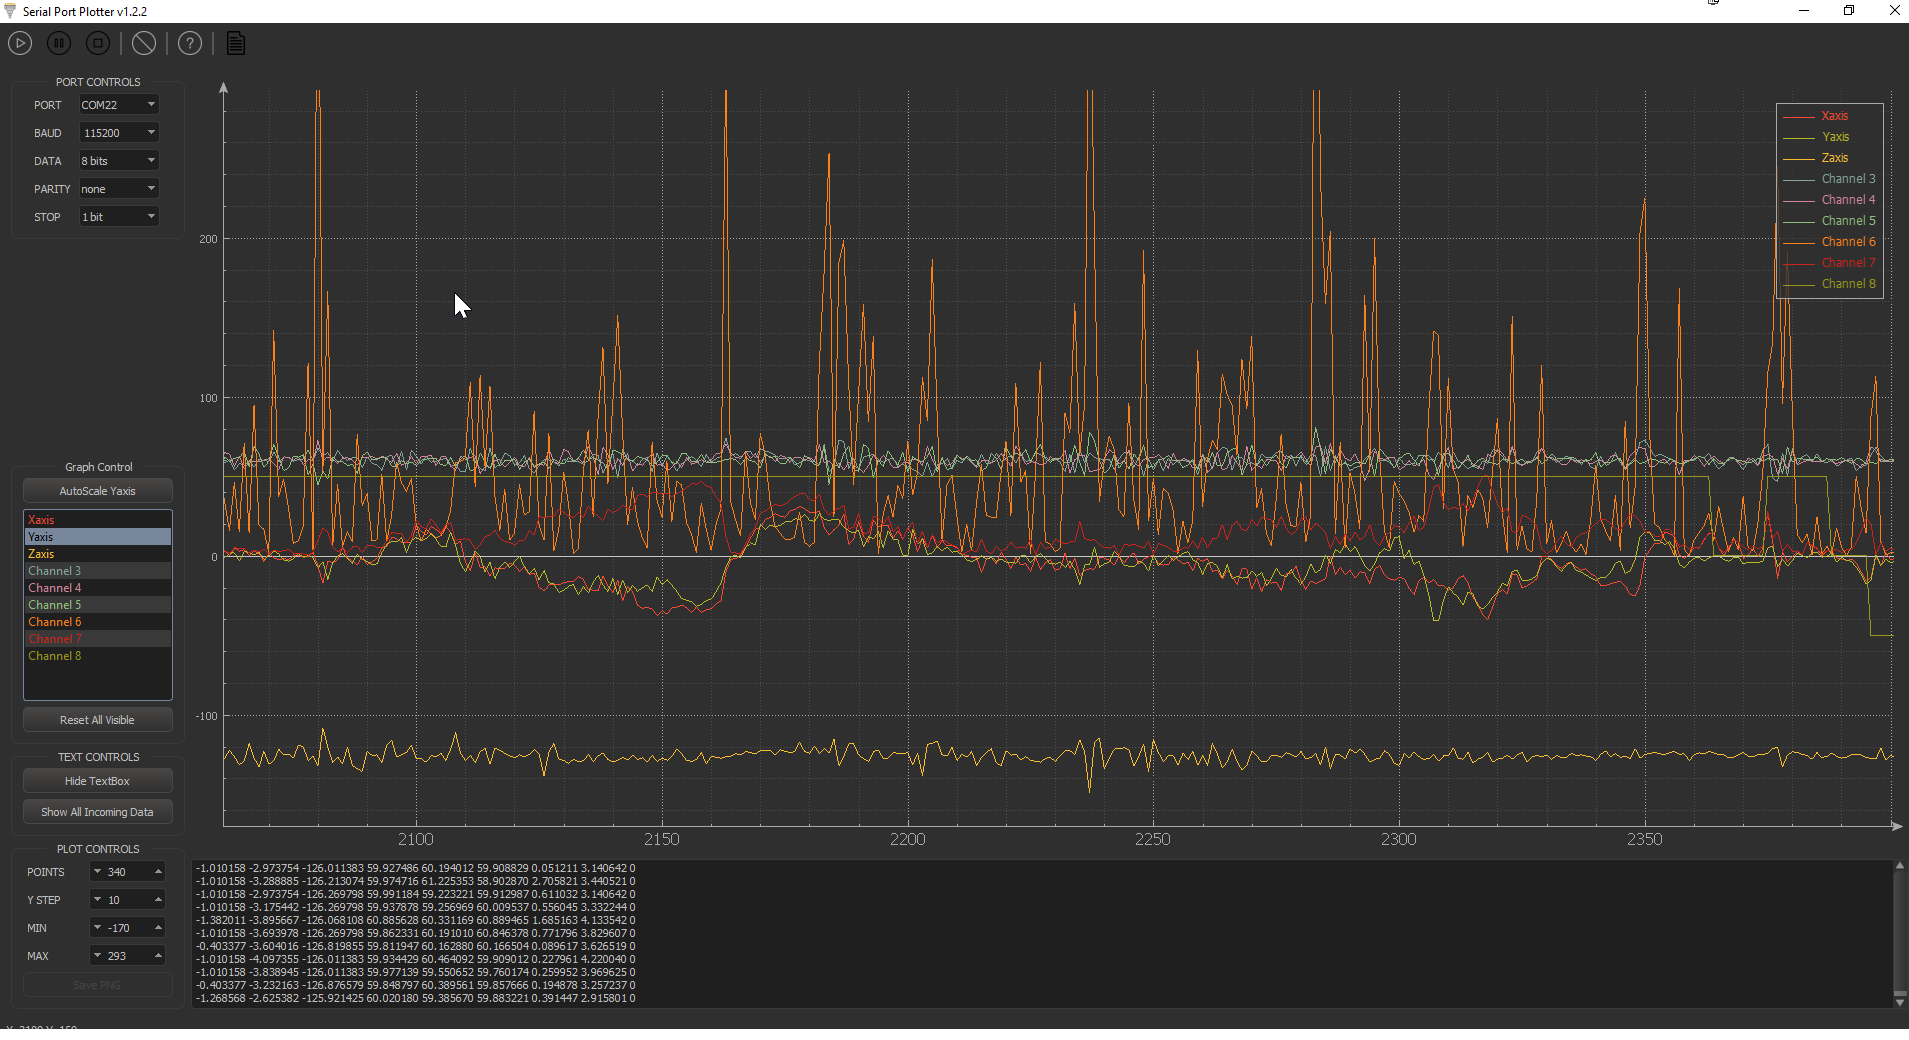
This program plots up to three axes of integer data collected from serial port. The data sent from the remote device needs to be in a certain format: every line must begin with '$' and end with ';'. The values must be space separated.
Example of sending data from mbed to this application:
pc.printf("$%d %d;", rawData, filteredData);
wait_ms(10);
To start using the program, connect your device to your PC and start sending data. Open Serial Port Plotter and:
- Specify number of axes you want to plot
- Specify number of data points that will be plotted. For example, if you send a data point every 10 ms and you plot 500 data points, the application will display 5 seconds of data.
- Steps and range for Y axis can be adjusted while running.
- Select a port, configure it and press Connect.
You can start and stop the plot using the button provided. The application can export the current plot to a JPG that is named under the current data point number and is saved in the directory of the executable file.
By scrolling and dragging with the mouse you can zoom in the plot; clicking on any point of the plot area displays the X and Y coordinates in the status bar.
Use Reset Plot button to set the graph to its defaults.
Axes colors:
- Axis 1: red
- Axis 2: Yellow
- Axis 3: Green
The application is created using Qt and QCustomPlot and compiled with MinGW 4.8.2 32 bit
Licence: GPL
Author: Borislav
Прикрепленные изображения
Сообщение отредактировал Aleksk: 16 апреля 2020 - 01:52